This chapter contains the following topics:
Setting Up Statement Processing
Printing a Specifications List
The Financial statements selection is used to specify the second and third phases in the financial statement process: the specification phase and the actual processing phase.
Use Enter specifications to define and maintain the specifications so that many different statements can be generated from any one layout. Both layouts and specifications are retained on file and both are needed for printing actual reports. In the broadest terms, the layout controls what appears in the different rows of the financial statement, and the specification controls what appears in the columns. Enter specifications lets you define a specification, change or delete it, or flag it for printing on the next run.
There are four other selections:
| • | Generalized selection flags a range of specifications for printing on the next print run. See Generalized Selection |
| • | Clear selections does the reverse. See Clearing Selections |
| • | Print specifications list prints one or more specifications in detail. See Printing a Specifications List |
| • | Use Print Financial statements to calculate the net income figures and account balances for the reporting period and then print all financial statements flagged for printing on the next run. See Printing Financial Statements |
Select
Enter specifications from the Financial statements menu.
This selection allows entry and maintenance of specifications. One or two tabs are required, depending on the type of financial statement.
Graphical Mode
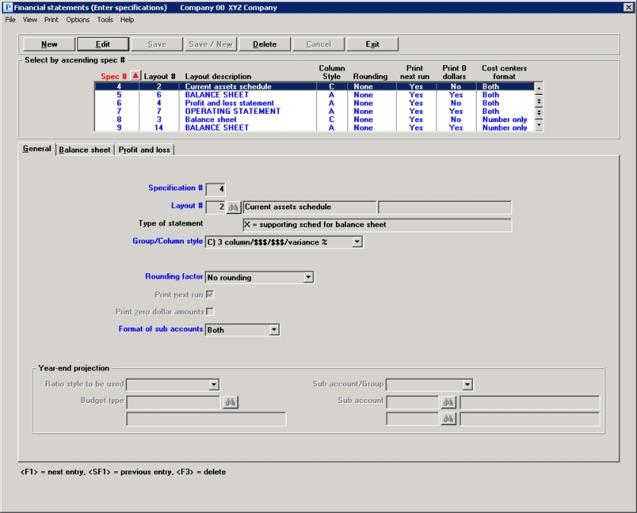
The first screen appears as follows:

Financial Statement Specifications List Box
The list box displays up to 6 existing specifications at a time. You may sort the specifications by specification number in ascending or descending order. To select a field or change the sort order, click on the column name or the arrow to the right of the column name or use the View options. Only column names in red may be sorted.
To locate a specification, start typing a specification number. You may also use the up/down arrows, Page up, Page down, Home and End keys to locate a specification. The <F1> and <SF1> keys function the same as the up/down arrows.
Specifications that display in the list box are available for changes or deletion. The fields for the selected specification display in the lower part of the screen.
When an specification is found, you may select the <Enter> key or Edit button to start editing.
Financial Statement Specifications Buttons
When you are adding or editing an existing specification, you have the following buttons, with keyboard equivalent options:
|
Button |
Keyboard |
Description |
|
New |
Alt+n |
To enter a new specification |
|
Edit |
Alt+e |
To edit an existing specification |
|
Delete |
Alt+d |
To delete an existing specification. You may also select <F3> to delete a specification |
|
Save |
Alt+s |
To save a new or edited specification |
|
Save/New |
Alt+w |
To save the new or edited specification with the program ready to enter another new specification |
|
Cancel |
Alt+c |
To cancel the entry of a new specification or cancel the editing of an existing specification |
|
Exit |
Alt+x |
To cancel editing or return to the menu. You may also select the <Esc> key to exit the screen |
Character Mode
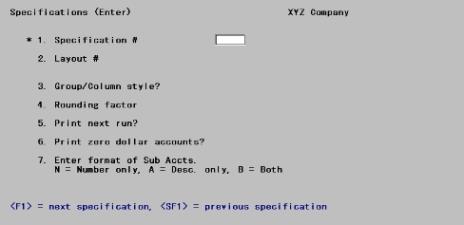
From this screen you can work with both new and existing specifications.
Options
Enter the number that you assign to identify the specification (the number cannot be zero), or use one of the options:
|
<F1> |
For the next specification |
|
<SF1> |
For the previous specification |
|
Format |
999 |
|
Example |
Type 001 |
We recommend that you group specifications numerically so that it will be easy to select all specifications within a particular numeric range for printing. For example, assign specification numbers 1 to 100 for financial statements for monthly reporting, 101 to 200 for quarterly reporting, and 201 to 300 for year-end reporting, etc.
Additionally, you could assign specification numbers 1 to 50 to profit and loss statements and supporting schedules, and 51 to 100 to balance sheets and supporting schedules.
Options
Enter the existing layout number to which these specifications will be applied, or use this option:
|
<F1> |
For the next layout |
|
<SF1> |
For the previous layout |
|
Format |
999 |
|
Example |
Type 001 |
When a layout is created, through the Financial statement layouts selection, it is assigned a statement type code from the list below. This controls which style of columns are available for the report. See the Financial Statement Layouts chapter.
|
B |
balance sheet |
|
P |
operating statement |
|
C |
cash flow statement |
|
E |
expanded cash flow statement |
|
W |
analysis of changes in working capital |
|
F |
statement of financial position |
|
S |
supporting schedule for operating statement |
|
X |
supporting schedule for balance sheet |
Options
| • | For statements that use staggered columns (e.g., balance sheets) in their formats, the following Group/Column styles are available: |
|
A |
3 column |
|
B |
3 column / 3 column |
|
C |
3 column / $$$/$$$ / variance % |
When specifying a Group/Column style for balance sheet (B), or supporting schedule for balance sheet (X), you may select from all three.
When specifying a Group/Column style for statement of financial position (F), you may only select from the first two.
Options
| • | For statements that use a single column in their formats, the following Group/Column styles are available. |
|
A |
$$$/$$$/$$$/$$$ |
|
B |
$$$/$$$/$$$-var-%%%/$$$-var-%%% |
|
C |
Year-end Projection |
|
D |
$$1/$$3/var-%%%/$$2/$$4var-%%% |
When specifying a Group/Column style for operating statement (P) or supporting schedule for operating statement (S), you may select from all four.
When specifying a Group/Column style for cash flow statement (C), expanded cash flow statement (E), or analysis of changes in working capital (W), the program automatically selects A.
In Character mode enter a letter for Group/Column style.
Your entry in this field controls the appearance and availability of the other tabs. If you select Year-end Projection, you may enter fields at the bottom of the General tab.
|
Format |
Graphical: Drop down list Character: One letter from the list above |
|
Example |
Type B |
Options
This is used when any of the amounts are greater than 999,999,999.99 due to space limitations on the statement. Rounding to the nearest dollar will allow up to 999,999,999,999 to print on the statement. Use one of the following options:
| Character Mode | Graphical Mode | Description |
|
D |
Dollar rounding |
Rounded to the nearest dollar. |
|
N |
No rounding |
No rounding. Dollars and cents are shown. This is not available for the year-end projection style. |
|
T |
Round to the nearest thousand |
Rounded to the nearest thousand dollars. This is only available for the year-end projection style. |
|
Format |
Graphical: Drop down list Character: One letter from the list above |
|
Example |
Type N |
This determines whether the financial statement for this specification will print the next time statements are run. Check the box or leave it unchecked (answer Y or N).
|
Format |
Graphical: Check box where checked is yes and unchecked is no. The default is unchecked. Character: One letter, either Y or N. The default is N |
|
Example |
Check the box or type Y |
Check the box (enter Y) to print zero dollar accounts, or leave it unchecked (N) not to print zero dollar accounts. This overrides the suppression of inactive accounts described in the Financial Statement Layouts chapter.
|
Format |
Graphical: Check box where checked is yes and unchecked is no. The default is unchecked. Character: One letter, either Y or N. The default is N |
|
Example |
Check the box or type Y |
Format of sub accounts
If your account number format has only one segment (the main account number), this field may not be entered.
Otherwise, if you have defined one or two segments for cost centers in your account number structure (in Company information), this caption appears in the first format. If you are using sub accounts, but not cost centers, this caption appears in the second format.
Options
This entry determines the identification of the cost center or sub account on the financial statement. Select from the following which type of identifier to print:
| Character | Graphical | Description |
|
N |
Number only |
For printing account numbers only |
|
A |
Description only |
For printing the account description only |
|
B |
Both |
For printing both numbers and description |
Descriptions will truncate at the column’s width.
|
Format |
Graphical: Drop down list Character: One letter from the list above |
|
Example |
Select Number only or type N |
Options
This completes the first screen of the selection Enter specifications. Make any changes as needed. For an existing entry you may also use one of the options:
|
<F1> |
For the next specification |
|
<SF1> |
For the previous specification |
|
<F3> |
To delete this specification |
What screen appears when you press <Enter> depends upon what group and column style you have chosen in the Group/Column style field (#3 in character). Each is described in a separate section of this chapter.
|
Column type |
Style |
For layout types: |
Chapter Section |
|
|
Staggered (typically used for balance sheets) |
A |
3 column |
B, X, F |
|
|
|
B |
3 column / 3 column |
B, X, F |
|
|
|
C |
3 column/$$$/$$$/variance % |
B, X |
|
|
Single |
A |
$$$/$$$/$$$/$$$ |
P, C, E,W, S |
|
|
|
B |
$$/$$/$$/$var%/$var% |
P, S |
|
|
|
C |
Year-end projection |
P, S |
|
|
|
D |
$$1/$$3/var-%%%/$$2/$$4var-%%% |
P,S |
|
There are three staggered column styles for Balance Sheets.
This format is typically used for Balance Sheet, Support Schedule for Balance Sheet, and Statement of Financial Position.
It is customary to request year-to-date figures for balance sheet layouts; but current period and year-to-date render the same results.
Graphical Mode
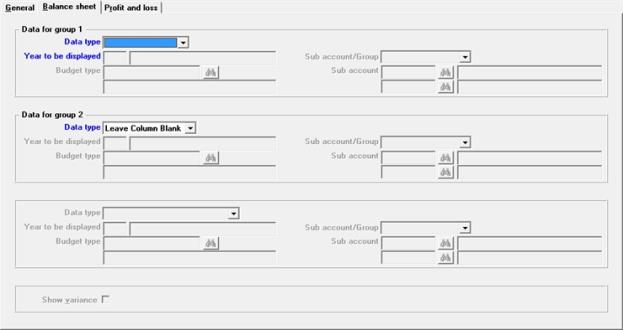
Enter the following Balance sheet tab:
Character Mode
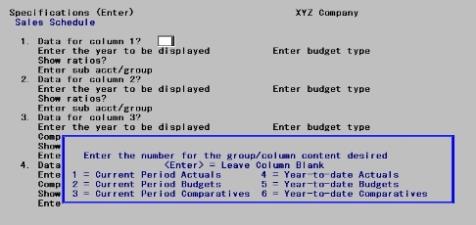
Enter information as follows:
Group 1 includes staggered columns 1, 2, and 3.
Options
In graphical mode, select from a drop down list. In character mode a pop-up window displays selections for the group/column content for the field.
Choose an option from the following table:
| Character | Graphical | Description |
|
1 |
Curr Pd Actuals |
For current-period actuals |
|
2 |
Curr Pd Budgets |
For current-period budgets |
|
3 |
Curr Pd Comparatives |
For current-period comparatives |
|
4 |
YTD Actuals |
For year-to-date actuals |
|
5 |
YTD Budgets |
For year-to-date budgets |
|
6 |
YTD Comparatives |
For year-to-date comparatives |
|
7 |
YTD |
For the difference between columns |
|
Blank |
Leave column blank |
To not use this column |
|
Format |
Graphical: Drop down list Character: 9 |
|
Example |
Type 4 |
For actuals, this field is automatically set to the current year; skip to Enter cost center/group.
For budgets, the years are relative to the reporting year. For comparatives, the years are relative to the current year.
Options
Enter the year to be displayed, or enter a value from the following:
|
0 |
For the reporting year |
|
+n |
For the number of years after the current or reporting year |
|
-n |
For the number of years before the current or reporting year |
|
Format |
Either 9999 or 9+ or 9- |
|
Example |
(Does not occur in this example because you selected actuals) |
This field only applies when you select budgets.
Options
Enter a valid budget type, or use one of the options:
|
<F1> |
For the next budget type |
|
<SF1> |
For the previous budget type |
|
Format |
15 characters |
|
Example |
(Does not occur in this example because you selected actuals) |
Sub account/group
If your account number format has only the main account segment, this field cannot be entered.
Options
Otherwise, enter one of:
|
Type |
If your account number format has: |
|
|
|
1 or 2 cost center segments |
A subaccount segment |
|
P |
For cost center |
For subaccount |
|
G |
For cost center group |
For subaccount group |
|
A |
For All cost centers |
For All subaccounts |
|
Format |
One letter from the list above |
|
Example |
Type A |
Options
| • | If you answer P, you will be prompted to enter a valid cost center. |
|
<F5> |
For <All> accounts (same as entering A) |
|
Format |
Your standard format as defined in Company information |
|
Example |
(Does not occur in this example because you have chosen A for All) |
If you are using cost centers, enter the cost center. If there are two segments, each one must be entered separately.Each segment must previously have been defined in Cost centers.You may leave this field blank only if a blank alphanumeric (or zero numeric) segment has been defined in Cost centers.
At each segment you may use one of the options:
|
<F1> |
For next |
|
<SF1> |
For previous |
|
<F5> |
For All accounts |
If your cost center has two segments you may use <F5> at either segment to select all departments for a particular division or vice versa, or at both segments to select all accounts regardless of cost center. The latter is effectively the same as entering A.
|
Format |
Your standard cost center format, in one or two segments, as defined in Company information |
|
Example |
(Does not occur in this example because you have chosen A for All) |
Options
If you answer G, enter the group code. This must previously have been defined in Cost center groups or Sub-account groups. You may use one of the options:
|
<F1> |
For the next group |
|
<SF1> |
For the previous group |
|
Format |
Eight characters |
|
Example |
(Does not occur in this example because you have chosen A for All) |
If you answer A, all accounts are selected without regard to cost center or subaccount.
Data for group 2
This field controls the appearance of the second group of three staggered columns, and is entered in the same way as Data for group 1.
If group 2 is left blank, Style B becomes identical to Style A; reports using this style may be printed on 8¾ X 11 paper even if your printer does not support condensed printing.
Make any needed changes. Press <Enter> to process another specification.
This style is the same as the preceding, except that the report contains only one group (set of three staggered columns) instead of two.
Graphical Mode
The following tab must be entered:
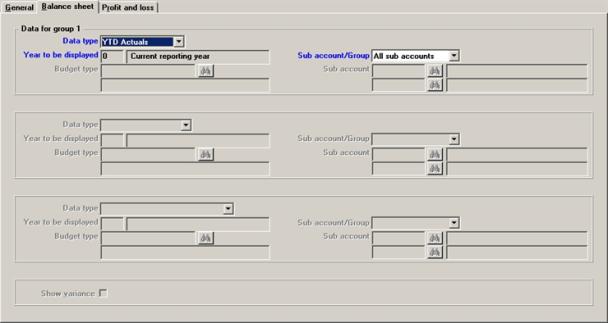
Character Mode
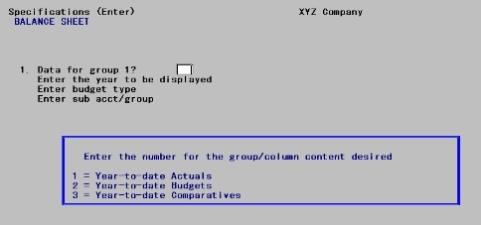
Information is entered at Field #1 in this screen exactly as it is at Fields #1 and #2 of the previous screen.
Reports using this style may be printed on 8½ X 11 paper even if your printer does not support condensed printing.
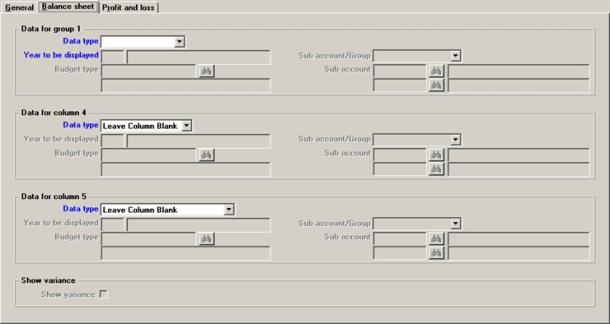
This style contains a single group of three staggered columns, just as the two preceding styles do.
The second group of three columns is not staggered. Instead, columns 4 and 5 can each contain a single actual, comparative, or budget amount. Instead of showing only one of these amounts, as Style A does, or two of them as style B does, three amounts are possible (of which only the first is in staggered columns).
The third of these amounts may contain the difference between the other two.
The sixth and last column does not contain an amount, but is available to contain a variance.
Graphical Mode
Enter the following tab:
Character Mode
The following screen appears:
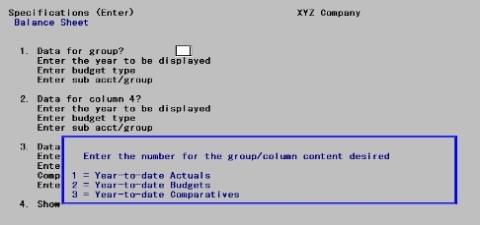
Enter information as follows:
Data for group
This field controls the appearance of the first group of three staggered columns, and is entered in the same way as the Data for group 1, in style B, described above.
Data for column 4
This field controls the appearance of the second amount, which prints in (unstaggered) in column 4. It is entered in the same way as the preceding.
Data for column 5
This field controls the appearance of the third amount, which prints in (unstaggered) in column 5. It is entered in the same way as the preceding, except that you can choose to print the difference between the first and second amounts. If you do so, compute group 1 minus column 4 displays automatically.
If you chose to print something other than a difference in column 5, this field cannot be entered.
Otherwise, check this box (answer Y) if you wish to show in column 6 the variance percentage corresponding to the difference in column 5; or leave it unchecked (N) to leave column 6 blank.
Variance % is calculated as the amount of the difference (column 5) divided by the amount which is subtracted (column 4).
|
Format |
Graphical: check box where checked is yes and unchecked is no. The default is unchecked One letter, either Y or N |
|
Example |
(Does not occur in this example because you have chosen staggered Style B) |
There are four Operating Statement single column styles.
This style is mandatory for layout types C, E, and W (cash flow, expanded cash flow, and changes in working capital). It is available for P and S (operating statements and their supporting schedules).
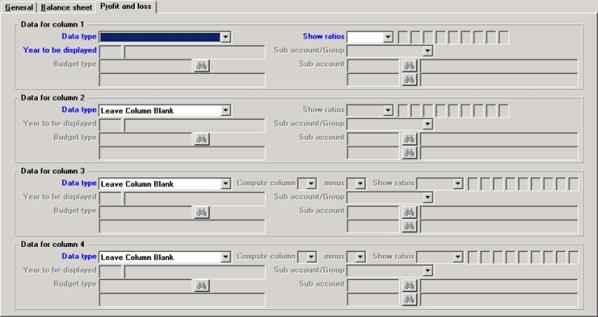
The single-column style allows more amounts to appear on the report than the staggered style. Four columns are available, each consisting of an amount subcolumn and a percentage subcolumn. The percent may be either a ratio or a variance.
Graphical Mode
Enter the following tab:
Character Mode
The following screen appears:
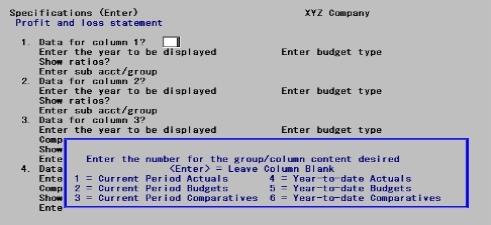
Enter information as follows:
Data for column 1
Column 1 controls the appearance of the first amount and is entered in the same way as Data for group 1 fields in staggered style B, described above. The subfields are arranged somewhat differently, but their meaning is the same.
Enter the data type.
Options
In graphical mode, select from a drop down list. In character mode a pop-up window displays selections for the group/column content for the field. Choose an option from the following table:
| Character | Graphical | Description |
|
1 |
Curr Pd Actuals |
For current period actuals |
|
2 |
Curr Pd Budgets |
For current period budgets |
|
3 |
Curr Pd Comparatives |
For current period comparatives |
|
4 |
YTD Actuals |
For year-to-date actuals |
|
5 |
YTD Budgets |
For year-to-date budgets |
|
6 |
YTD Comparatives |
For year-to-date comparatives |
|
7 |
YTD |
For the difference between columns |
|
Blank |
Leave column blank |
To not use this column |
|
Format |
Graphical: Drop down list Character: 9 |
|
Example |
Type 4 |
For actuals, this field is automatically set to the current year; skip to Enter cost center/group.
For budgets, the years are relative to the reporting year. For comparatives, the years are relative to the current year.
Options
Enter the year to be displayed, or enter a value from the following:
|
0 |
For the reporting year |
|
+n |
For the number of years after the current or reporting year |
|
-n |
For the number of years before the current or reporting year |
|
Format |
Either 9999 or 9+ or 9- |
|
Example |
(Does not occur in this example because you selected actuals) |
This field only applies when you select budgets.
Options
Enter a valid budget type, or use one of the options:
|
<F1> |
For the next budget type |
|
<SF1> |
For the previous budget type |
|
Format |
15 characters |
|
Example |
(Does not occur in this example because you selected actuals) |
There is an additional subfield:
Ratios express the percentage that the amount on this line is to a total computed from other numbers in this column. Variances express the percentage that the amount on this line is of another amount in this row.
Options
Your choices are:
| Character | Graphical | Description |
|
N |
Neither |
For neither ratio |
|
R |
Ratio |
For ratios |
|
S |
Selected |
For selected ratios |
|
V |
Variance |
For a variance. This option is available only if the amount in this column is a difference, which can only occur in the Data for column 3 and 4 fields. |
|
Format |
One choice from the list above |
|
Example |
(Does not occur in this example because you have chosen staggered Style B) |
If you chose selected ratios, enter one to nine selected ratios you want to print. Refer to the Financial Statement Layouts chapter for information on setting up selected ratios.
|
Format |
One digit in up to nine subfields. Digits may be in any order, but must not be duplicated. The first blank terminates entry. |
|
Example |
(Does not occur in this example because you have chosen staggered Style B) |
Data for column 2
These fields controls the appearance of the second amount, which is entered in the same way as the preceding.
Data for column 3 and
Data for column 4
These fields control the appearance of the third and fourth amounts. These are entered in the same way as the preceding except that the option of specifying a difference is now available. If you choose a difference amount, you can select the difference between any two of the amounts already entered. You can also choose to print a variance instead of a ratio.
Compute column a minus column b
If the amount in this column is anything other than a difference, these fields may not be entered.
If the amount in this column is a difference, enter which two columns you want the difference between.
|
Format |
One digit, either 1, 2, or 3, at each subfield. The columns must be different from each other, may not be the same as the current column, and may not be blank. |
|
Example |
(Does not occur in this example because you have chosen staggered Style B) |
This style is available for layout types P and S (operating statements and their supporting schedules).
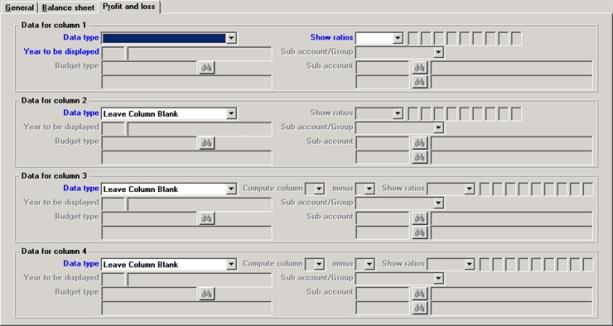
This style is a variation on style A. There are still four columns, but no longer does each amount column have its own percent subcolumn. Instead, the first two amounts have shed their subcolumns, while the second two amounts each have two subcolumns — one for variance amount (difference), and one for variance percent.
Graphical Mode
Enter the following tab:
Character Mode
The following screen appears:
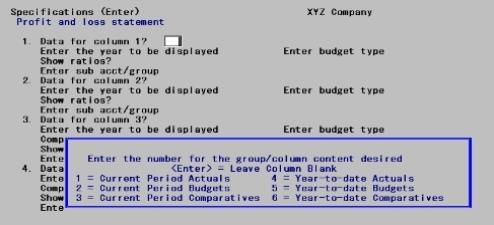
Style B uses the same screen as Style A. The differences are:
| • | You may not specify a difference amount for any of the four columns. Difference is prohibited in the first two columns and automatic in the last two. |
| • | Compute column a minus column b must be entered in Data for columns 3 and 4 (unless the column is blank), and in each case one of the two subfields entered must reference the current column. |
Options
| • | Show ratios must be entered in the Data for columns 3 and 4 fields unless the column is blank, and in each case the only choices are: |
| Character | Graphical | Description |
|
N |
Neither |
Leave the variance subcolumn blank |
|
V |
Variance |
Show the variance percentage corresponding to the amount in the variance subcolumn |
This style is available for layout types P and S (operating statements and their supporting schedules).
This style is a variation on style B.
With column style D four fields the Compute column and minus fields are filled in automatically and cannot be changed. Compared to style B, the sequence of the columns printed is 1,3,2,4. Printing of the "Ratio" is optional.
Graphical Mode
Enter the following tab:

Character Mode
The following screen appears:

Style B uses the same screen as Style A. The differences are:
| • | You may not specify a difference amount for any of the four columns. Difference is prohibited in the first two columns and automatic in the last two. |
| • | Compute column a minus column b must be entered in Data for columns 3 and 4 (unless the column is blank), and in each case one of the two subfields entered must reference the current column. |
Options
| • | Show ratios must be entered in the Data for columns 3 and 4 fields unless the column is blank, and in each case the only choices are: |
| Character | Graphical | Description |
|
N |
Neither |
Leave the variance subcolumn blank |
|
V |
Variance |
Show the variance percentage corresponding to the amount in the variance subcolumn |
Style C prints a year-end projection, and is available for layout types P and S (operating statements and their supporting schedules).
Options on this screen are few compared to the preceding because most columns are predefined. Twelve columns contain data for the periods of this fiscal year — actual amounts for past periods and budget amounts for future periods. The thirteenth period if any is folded into the twelfth.
Graphical Mode
Enter the Year-end projection fields on the General tab:

Character Mode
The following screen appears:
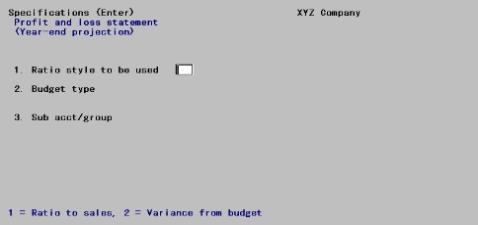
Enter information as follows:
Options
This controls the contents of the rightmost or percentage column of the report. Your options are:
| Character | Graphical | Description |
|
1 |
Ratio to sales |
For ratio to sales |
|
2 |
Variance from budget |
For variance from budget |
|
Format |
Graphical: Drop down list Character: 9 |
|
Example |
(Does not occur in this example because you have chosen staggered Style B) |
Options
The budget year is automatically set to the current year. Enter a budget type valid for that year, or use the options:
|
<F1> |
For the next budget type |
|
<SF1> |
For the previous budget type |
|
Format |
15 characters |
|
Example |
(Does not occur in this example because you have chosen staggered Style B) |
Cost center/Group or
Sub account/Group
This is entered in the same way as the corresponding field in staggered-column style B described above.
Make any needed changes. Press <Enter> to process another specification.
The Generalized selection function lets you check the Print next run field (field #5 in the Enter specifications selection) on all specifications at once, or on any range of specifications. This is merely a convenient alternative to setting the flag on each specification individually each time you want to print that report.
Select
Generalized selection from the Financial statements menu.
Graphical Mode
The following screen appears:
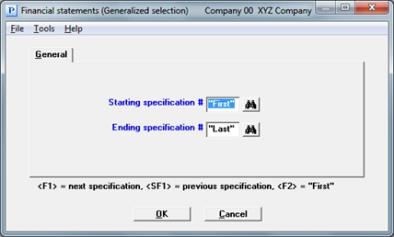
Character Mode
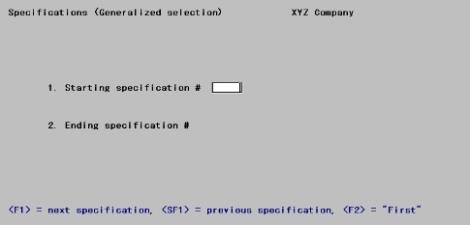
Enter information as follows:
Ending specification #
Options
Enter the range of specifications to select for printing, or use one of the options:
|
<F1> |
For the next specification |
|
<SF1> |
For the previous specification |
|
<F2> |
For the <First> starting specification or <Last> ending specification |
|
Format |
999 |
|
Example |
Press <F2> at each field |
Make any needed changes. Select OK to return to the menu.
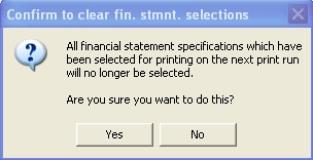
This function enables you to clear the Print next run entry on all print specifications. See Print next run
Select
Clear selections from the Financial statements menu.
Graphical Mode
The following screen appears:
Graphical Mode
Character Mode
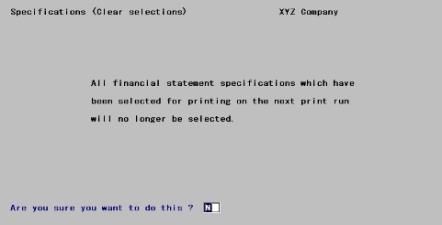
Enter information as follows:
Are you sure you want to do this?
Select Yes (enter Y) to proceed to deselect specifications, or select No (N) to cancel and return to the Financial Statements (Specifications) menu.
|
Format |
Graphical: Yes/No push buttons Character: One letter, either Y or N |
|
Example |
Select Yes or type Y |
The Print specifications list selection enables verification of the specifications entered for the statements.
See a Financial Statement Specifications List example in the Sample reports appendix.
Select
Print specifications list from the Financial statements menu.
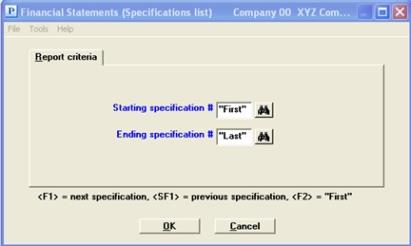
A screen appears for you to enter the starting and ending numbers of the specifications to be printed.
The following screen appears:
Graphical Mode
Character Mode
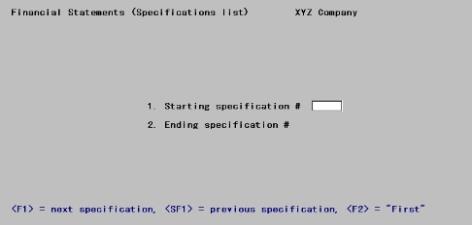
Enter information as follows:
Ending specification #
Options
Enter the range of specifications to be printed, or use one of the following options:
|
<F1> |
For the next specification |
|
<SF1> |
For the previous specification |
|
<F2> |
For the <First> starting specification or <Last> ending specification |
|
Format |
999 |
|
Example |
Press <F2> at each field. |
Make any needed changes. Press <Enter> to print the Financial Statement Specifications List.
The Print financial statements selection enables you to print the financial statements you have selected. All specifications are printed which have the Print next run set.
Note that running this selection does not turn off this flag. It remains on for the next accounting period’s run. If you are running reports individually, you should run Clear selections after each print run.
Financial statements may be printed to a printer, viewed on screen or data can be sent to a CSV spreadsheet file format for viewing in programs like Excel™. See Comma-separated-values (CSV)
See a Balance Sheet example in the Sample reports appendix.
Select
Print Financial statements from the Financial statements menu.
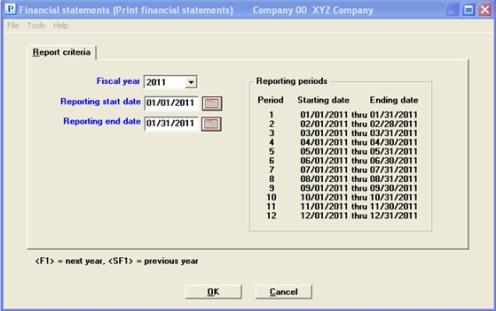
A screen similar to the following appears:
Graphical Mode
Character Mode
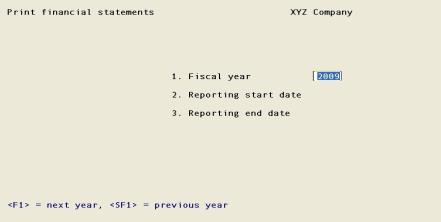
Enter information as follows:
Options
Enter the year that you want to view, or use the option:
|
<F1> |
For the next year |
|
<SF1> |
For the previous year |
|
Format |
CCYY |
|
Example |
2015 |
Reporting start date and Reporting end date
Options
Enter a range of dates to report. These need not correspond with an accounting period but must be within the fiscal year designated in the first field.
|
Format |
MMDDYY at each field. The defaults are the starting and ending dates of the current period for the year selected. |
|
Example |
Enter 010115 for start date and 013115 for end date. |
Make any needed changes. Select OK (press <Enter> in character mode). Select Cancel or <Esc> to return to the menu.
Select a printer or view option.
The next screen, unlike most, does not display until after you have selected a printer:
Graphical Mode
Character Mode
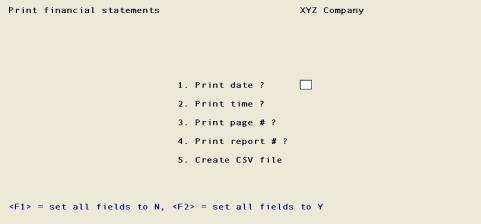
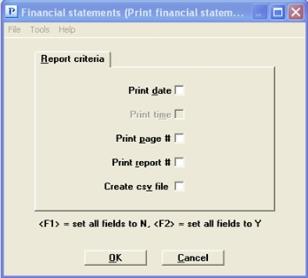
This lets you choose whether or not to print the standard page headings. Typically, such top-line information is omitted from the final printing of financial statements. Also, when not displaying on screen, you have an option to send the financial statements to CSV files. See Create csv file
Enter information as follows:
Check the box (answer Y) to print, or leave it unchecked (N) to omit, today’s date on the statement. You may use one of the options:
|
<F1> |
Graphical: Select all as unchecked Character: Set all fields to N |
|
<F2> |
Graphical: Check all the boxes Character: Set all fields to Y |
|
Format |
Graphical: Check box where checked is yes and unchecked is no Character Mode: One letter, either Y or N |
|
Example |
Press <F1> |
You may only print the time if you are printing the date.
Check the box (answer Y) to print, or leave it unchecked (N) to omit, the time of printing on the statements.
|
Format |
Graphical: Check box where checked is yes and unchecked is no Character Mode: One letter, either Y or N |
|
Example |
May not be entered as the date is not being printed |
Check the box (answer Y) to print, or leave it unchecked (N) to omit, the page number on each statement page.
|
Format |
Graphical: Check box where checked is yes and unchecked is no Character Mode: One letter, either Y or N |
|
Example |
(Automatically set to N) |
This field cannot be entered if you selected to view on screen via HTM or PDF.
Otherwise, check the box (answer Y) to print, or leave it unchecked (N) to omit, the report number on each statement printed.
|
Format |
Graphical: Check box where checked is yes and unchecked is no Character Mode: One letter, either Y or N |
|
Example |
(Automatically set to N) |
This field cannot be entered if you selected to view on screen via HTML or PDF.
Check this box (answer Y) to create a CSV text file or leave it unchecked (N) to not create a file. See Comma-separated-values (CSV).
|
Format |
Graphical: Check box where checked is yes and unchecked is no Character Mode: One letter, either Y or N |
|
Example |
Select the Space bar to check the box Y |
In Windows when you create a CSV file, a save-as window will display. In this window a default name is provided but you can change the name. Also, you may change the location of where the report prints.
If there is more than one report selected in 'Print next run', you will be prompted to enter a name and save each report.
Make any needed changes. Select OK (press <Enter> in character mode). There will be a period of processing as reports are printed. The screen will display which specification is currently printing.
Select Cancel to return to the menu without printing.
The accounting periods record contain two non-closed fiscal years - one is for the current (or first) year and the other is the next year. Financial Statement may provide reports on either year.
When running a financial statement for data in the next year, a temporary file is created that does the “work” of providing access to the current year data plus the balance brought forward data from the end of the first accounting periods current year - like the year has been closed. This allows you to work in the next year and still get the balance brought forward and comparative data from the current year. For this reason, you are not required to close the current accounting periods year in order to get the closed year data when reporting in the next year.
When you post new entries into general ledger transactions, the temporary work file is removed. The next time you run financial statements an updated work file that also contains the new entries, is generated again.
Temporary Close a Year and Balance Brought Forward
When the Accounting Period data is set up for entering and reporting on next fiscal year, the Financial Statements access balance brought forward information, as if a Close a year had been run on the first year.
Financial Statements and Comparatives
When running financial statements, there is an option to automatically generate comparative data from the current year when reporting on the next year or you may use the data entered in Comparatives. This screen only displays if you have manually entered comparative data for the first year. Otherwise it assumes you want to use the calculated data. In graphical mode this window displays:
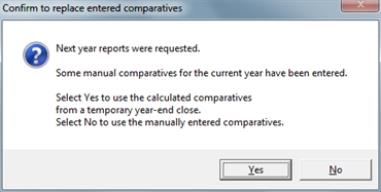
The answer to this question determines your choice of using either the calculated data from the temporary year-end close or the manually entered comparative data entered in Comparatives.
Select Yes to use the temporary calculated comparatives or No to use the manually entered comparatives.
In character mode a similar window displays with the question: Use the calculated comparatives ? Enter Y to use the temporary calculated comparatives or enter N to use the manually entered comparatives.
Temporary Data and Path Structure
In order to provide a storage area for the temporary file, a new folder structure is automatically created when you run the financial statements. These folders contain the work file which for the company and fiscal year being reported. As an example, the folder path for a company 00 2015 work file is this: PBS\TRXDAT\002015.
The temporary files are removed during postings in Distributions and General Journal and when running the file utilities for the G/L Transaction data. That is because the postings change data which require new temporary files. An export and restore may also change the data. The next time the reports are run, the temporary files are recreated.
f you get the message Incorrect access rights to TRXDAT\(filename) . Contact your administrator., you must get the proper credentials to create a file in the TRXDAT folder.
There are some basic rules in General Ledger regarding the printing of BSNI (Balance Sheet Net Income). BSNI is the code which you include on your Balance Sheet layout in order to print the net profit (or loss) for the period. The rules regarding BSNI are:
| • | Whenever financial statement printing begins (that is, whenever Print financial statements is selected), BSNI is recalculated by the software to be the total NET PROFIT (or LOSS) for all profit and loss entries on file. |
| • | The BSNI which is set at the beginning of financial statement printing should be used to show NET PROFIT (or LOSS) on the Balance Sheet. |