This appendix contains the following topics:
Introduction to Standard Cost Valuation
This appendix describes how to use the Standard Cost valuation option, one of the cost options available in Inventory Control.
Standard Cost is designed to assist wholesalers and distributors in assigning profit responsibility between the purchasing and sales departments.
It is desirable that an in-house Certified Management Accountant or Certified Public Accountant be assigned the responsibility of monitoring and interpreting the information produced by this Standard Cost system.
If your company does not have a qualified person to monitor a Standard Cost system, we suggest that you select one of the other valuation options available (average, LIFO or FIFO). These methods do not require the same level of monitoring or interpretation and they can normally be handled by a general manager on a day-to-day basis and then adjusted by a Certified Public Accountant at year end.
This Standard Cost module was designed to be a modified, not a traditional, Standard Cost system for a manufacturing company. It isolates a material price variance at time of purchase, but does not address material usage, labor cost, or overhead.
This chapter begins with a discussion of setting up the Inventory Control module for the standard valuation method, followed by descriptions of transaction processing involving receivings, sales, credit memos and adjustments.
The following should help you and your accountant decide if the Standard Cost method is appropriate for your company, and it should also serve as a reference for processing Standard Cost transactions.
When the Standard Cost valuation method is selected in your I/C Control information, your inventory can be valued at both standard and actual (average) cost.
This means that all your accounting transactions (booked to the G/L) are made using a Standard Cost per unit; however, perpetual average cost is also calculated and recorded (but not booked). This allows you to identify both the Standard Cost of your inventory (per your G/L distribution), as well as the actual cost of your inventory (per the Valuation Report with the A method selected).
You may set the I/C Control information so that receivings will update an item’s Standard Cost with it’s replacement cost. The examples in this section are based on the I/C Control information set to not update Standard Cost with Replacement Cost.
The following should assist you in understanding the processing logic used for Standard Costing. Several transactions are illustrated and the set-up of selected master data is shown.
Set up or verify the information in this data:
1. Valid G/L Accounts
These accounts below will be used throughout the illustrations for the Standard Cost method:
|
account # |
description |
|
1100-000 |
Accounts Receivable |
|
1200-000 |
Merchandise Inventory |
|
2000-000 |
Accounts Payable |
|
4010-100 |
Sales - Tools |
|
5070-000 |
Cost of Goods Sold |
|
5080-000 |
Credit Memo |
|
7000-000 |
Inventory Adjustments |
|
7010-000 |
Purchase Variances |
|
7020-000 |
Credit Memo/Adj Variance |
2. I/C Control information
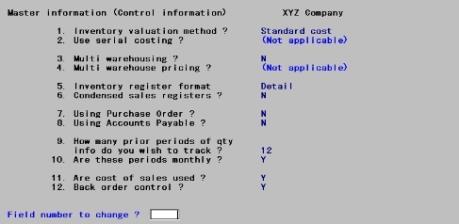
Use Control information to set up the I/C Control information as shown on the following four screens:

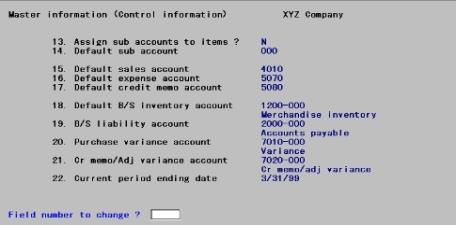
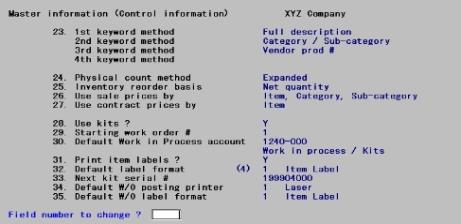
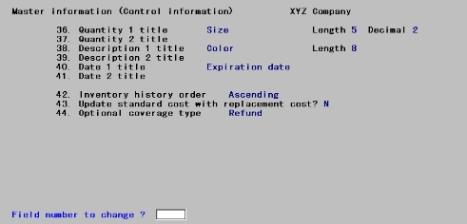
|
Note |
The Standard Cost example explained here requires that the Control information field #43 above is set to N. If you do choose the Update standard cost with replacement cost, this discussion does not apply to your setup. |
3. Items
If field # 24 in Items for item number 3 (Wrench) does not currently show a quantity on hand of zero, you will need to either enter an adjustment transaction to leave a zero quantity balance or initialize Items and re-enter the data for item number 3 using the Items menu selection.
For our examples to make sense, the inventory account for this item should be 1200-000 and the credit memo account should be 5080. Prior to entering the item data for item number 3, set up the pricing code and commission code shown, if you have not already defined them.
Item #3 should be set up as follows:
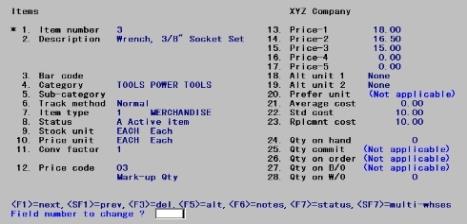
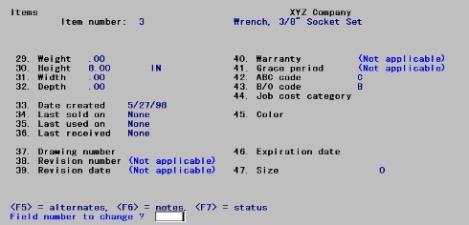
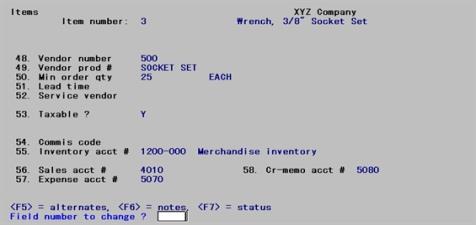
On the status information screen, enter 2 for the location code, 20 for the maximum quantity, and 10 for the reorder level. Enter zero amounts for all sold and used fields on the status information screens.
Receivings
Now that your three master files/tables have been verified as correct, some accounting transactions can be illustrated.
A new date will be used for each transaction illustrated in this chapter. You will then be able to sort printouts by the transaction dates.
Select Enter from Inventory from the I/C menu. Enter the following receiving:
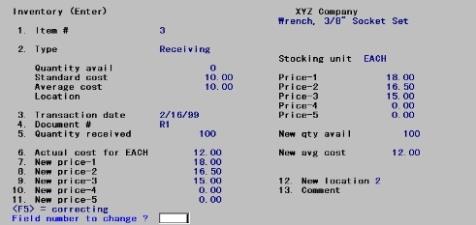
Note that this purchase was made at an actual cost of $12.00 per unit and the standard unit cost was $10.00.
You may print an Edit List to verify the transaction was properly entered.
After you have verified that the receiving was properly entered, select Post from the Inventory menu to post the receiving to the inventory files/tables.
When you post the transaction, a register is printed.
Posting causes certain cost fields in Items and accounting activity in I/C Distributions to G/L to be updated.
The Item and Distribution changes are illustrated below, along with T-Account representations of the posting activity. BB in the T-Accounts below is an abbreviation for Beginning Balance.
The Item data is not a G/L account; however, it is updated during posting and provides you with perpetual average cost information for a valuation report.
|
Old Qty. |
Old Avg. Cost |
New Qty. |
New Avg. Cost |
|
0 |
0 |
100 |
$12.00 |
Actual entries in I/C Distributions to G/L:
|
Debit Merchandise Inventory |
$1000 |
|
Debit Purchase Variances |
$200 |
|
Credit Accounts Payable |
$1200 |
|
1100-000 |
|
1200-000 |
|
2000-000 |
|||||||||
|
Accounts Receivable |
|
Merchandise Inventory |
|
Accounts Payable |
|||||||||
|
BB |
00 |
|
|
|
BB |
0 |
|
|
|
|
|
0 |
BB |
|
|
|
|
|
|
|
$1000 |
|
|
|
|
|
$1200 |
|
|
7000-000 |
|
5070-000 |
|
4010-000 |
|||||||||
|
Inventory Adjustments |
|
Cost of Goods Sold |
|
Sales |
|||||||||
|
BB |
0 |
|
|
|
BB |
0 |
|
|
|
|
|
0 |
BB |
|
7010-000 |
|
7020-000 |
|
5080-000 |
|||||||||
|
Purchase Variance |
|
Cr Memo/Adj Variance |
|
Credit Memo |
|||||||||
|
BB |
0 |
|
|
|
BB |
0 |
|
|
|
|
|
0 |
BB |
|
|
$200 |
|
|
|
|
|
|
|
|
|
|
|
|
Example
Print the Distributions to G/L Report by selecting Distributions to G/L from the Reports menu. Use First to Last for both the account number range and the date range.
Notice that merchandise inventory is distributed at Standard Cost, accounts payable is at actual cost, and the purchase variance is the difference between actual cost and Standard Cost.
Now print a valuation report using the Standard Cost option.
Example
Select Valuation report from the Reports menu.
Enter the following information:
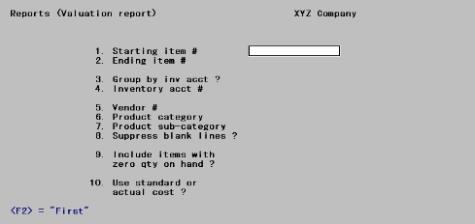
Now print the Valuation Report again, answering Y to Include items with zero qty on hand ? and using Actual cost.
Notice that the inventory value at Standard Cost is $1000 (the value in the Merchandise Inventory account). The value at actual cost is $1200 (Merchandise Inventory Control Purchase Variances).
Now examine Items again and see what has happened.
Example
Select Items from the I/C menu
Type 3 to see the information for item number 3, as shown below:
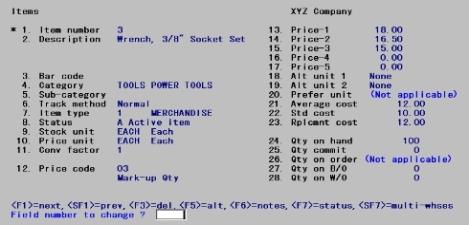
Notice that the average cost field has been updated to reflect the receiving. Replacement cost has also been adjusted to the last receiving.
Sales
To illustrate a sale, exit to the I/C menu, and select Inventory. Then select Enter. Enter the following transaction:
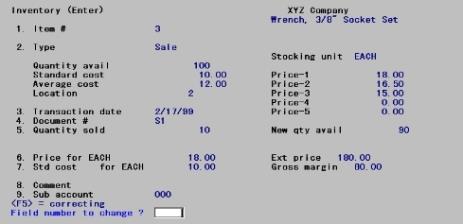
Note that this sale was made at the Standard Cost of $10.00, not the actual cost of $12.00. Field number 7 defaults to Standard Cost.
Run the edit list to verify the transaction was properly entered.
Select Post from the Inventory menu to post the sale to the Inventory data.
When you post the transaction, a register will be printed.
Posting causes certain fields in Items and I/C Distributions to G/L to be updated. Items and Distribution data changes are illustrated below, along with T-account representations of the posting activity.
|
Old Qty. |
Old Avg. Cost |
New Qty |
New Avg. Cost |
|
100 |
$12.00 |
90 |
$12.00 |
Actual entries in I/C Distributions to G/L:
|
Debit Cost of Goods Sold |
|
|
Credit Merchandise |
$100 |
|
1100-000 |
|
1200-000 |
|
2000-000 |
|||||||||
|
Accounts Receivable |
|
Merchandise Inventory |
|
Accounts Payable |
|||||||||
|
BB |
00 |
|
|
|
BB |
0 |
|
|
|
|
|
0 |
BB |
|
|
|
|
|
|
|
$1000 |
|
|
|
|
|
$1200 |
|
|
|
|
|
|
|
|
|
$100 |
|
|
|
|
|
|
|
7000-000 |
|
5070-000 |
|
4010-000 |
|||||||||
|
Inventory Adjustments |
|
Cost of Goods Sold |
|
Sales |
|||||||||
|
BB |
0 |
|
|
|
BB |
0 |
|
|
|
|
|
0 |
BB |
|
|
|
|
|
|
|
$100 |
|
|
|
|
|
|
|
|
7010-000 |
|
7020-000 |
|
5080-000 |
|||||||||
|
Purchase Variance |
|
Cr Memo/Adj Variance |
|
Credit Memo |
|||||||||
|
BB |
0 |
|
|
|
BB |
0 |
|
|
|
|
|
0 |
BB |
|
|
$200 |
|
|
|
|
|
|
|
|
|
|
|
|
Note that a sale does not change the actual average cost.
Also note that neither sales nor accounts receivable entries are generated by Inventory Control. Such entries would be generated by Order Entry or Accounts Receivable. If you are not using these modules, you must enter a sale transaction in Accounts Receivable. If you are not using A/R, then you must make a journal entry in General Ledger.
Distributions to the General Ledger after a Sale
Print the Distributions to G/L Report by selecting Distributions to G/L from the Reports menu. Use First to Last for both the account number range and the date range.
Valuation Reports after a Sale
Print two valuation reports, one using Standard Cost and the other actual cost.
Select Valuation report from the Reports menu, and print Valuation reports for item number 3, one using Standard Cost and one using average cost.
Item Data after a Sale
Examine Items again and see what has happened.
Select Items from the I/C menu and enter 3 to see the information for item number 3. After viewing this screen, look at the Status screen.
Notice that the quantity on hand, Last sold on date, and PTD/YTD fields have been updated to reflect the sale.
To introduce you to credit memos under Standard Costing, select Inventory, then select Enter.
Enter the information shown on the following screen.
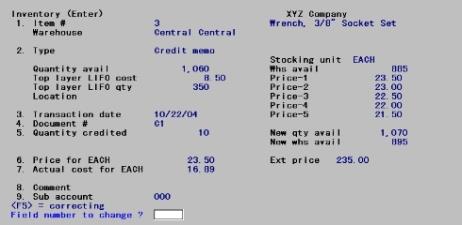
Be certain to enter the credit memo using the same price and cost (standard) at which the item was originally sold. This allows the system to correctly update Items at average cost, and I/C Distributions using Standard Cost.
If you issue credit for damaged goods or goods that will not be returned to inventory, then you should use the Accounts Receivable module or make a General Journal entry in the General Ledger module to debit the Sales account and credit the Accounts Receivable account.
This will inflate your PTD/YTD figures, but your inventory quantities and your distributions will be correct.
Example: Select Post from the Inventory menu to post the credit memo to the inventory data. A register will be printed.
Posting causes certain fields in Items and I/C Distributions to G/L to be updated. Items and Distributions data changes are illustrated below, along with T-account representations of the posting activity.
|
Old Qty. |
Old Avg. Cost |
New Qty |
New Avg. Cost |
|
90 |
$12.00 |
100 |
$11.80 |
Actual entries in I/C Distributions to G/L:
|
Debit Merchandise Inventory |
$100 |
|
Credit Memo (actual) |
|
|
1100-000 |
|
1200-000 |
|
2000-000 |
|||||||||
|
Accounts Receivable |
|
Merchandise Inventory |
|
Accounts Payable |
|||||||||
|
BB |
00 |
|
|
|
BB |
0 |
|
|
|
|
|
0 |
BB |
|
|
|
|
|
|
|
$1000 |
|
|
|
|
|
$1200 |
|
|
|
|
|
|
|
|
|
$100 |
|
|
|
|
|
|
|
|
|
|
|
|
|
$100 |
|
|
|
|
|
|
|
|
7000-000 |
|
5070-000 |
|
4010-000 |
|||||||||
|
Inventory Adjustments |
|
Cost of Goods Sold |
|
Sales |
|||||||||
|
BB |
0 |
|
|
|
BB |
0 |
|
|
|
|
|
0 |
BB |
|
|
|
|
|
|
|
$100 |
|
|
|
|
|
|
|
|
7010-000 |
|
7020-000 |
|
5080-000 |
|||||||||
|
Purchase Variance |
|
Cr Memo/Adj Variance |
|
Credit Memo |
|||||||||
|
BB |
0 |
|
|
|
BB |
0 |
|
|
|
|
|
0 |
BB |
|
|
$200 |
|
|
|
|
|
|
|
|
|
|
$100 |
|
The item will be added back to inventory at actual cost. If there was a difference between Standard Cost and actual cost when the unit was originally sold, then you should use an adjustment transaction to account for this difference.
In order to illustrate this difference, it was assumed (incorrectly) that the Standard Cost of $10.00/unit was the actual cost. This will be corrected in a downward adjustment.
Distributions to General Ledger after a Credit Memo
Print the Distributions to G/L Report by selecting Distributions to G/L from the Reports menu. Use First to Last for both the account number range and the date range.
Valuation Report after a Credit Memo
Print a valuation report at the Standard Cost and then at actual cost.
Select Valuation report from the Reports menu, and print Valuation reports for item number 3, one using Standard Cost and one using average cost.
The Item Data after a Credit Memo
Now examine Items data again.
After viewing this screen, look at the Status screen.
Note that the average cost, quantity on hand, and PTD/YTD figures have been updated, but not the replacement cost.
This transaction illustrates the handling of a downward adjustment.
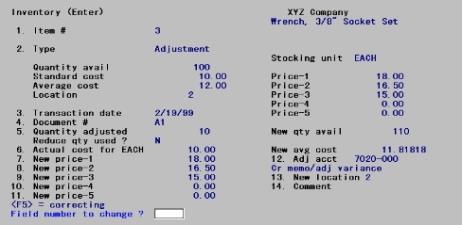
The purpose of this adjustment is to reverse the credit memo. Be certain to enter the $10.00 actual cost that was used in the earlier credit memo. This was used as the cost at the time of sale, and is the Standard Cost as found in Items data at the time of sale.
An adjustment transaction allows you to adjust your quantity on hand so that it reflects the actual physical count in your inventory.
Posting after a Downward Adjustment
Example: Select Post from the Inventory menu to post the adjustment. A register will be printed.
Posting causes certain fields in Item data and I/C Distributions to G/L to be updated. Items data and Distribution data changes are illustrated below, along with T-account representations of the posting activity.
|
Old Qty |
Old Avg. Cost |
New Qty |
New Avg. Cost |
|
100 |
$11.80 |
90 |
$12.00 |
Actual entries in I/C Distributions to G/L:
Debit Inventory Adjustments $100
Credit Merchandise Inventory $100
|
1100-000 |
|
1200-000 |
|
2000-000 |
|||||||||
|
Accounts Receivable |
|
Merchandise Inventory |
|
Accounts Payable |
|||||||||
|
BB |
00 |
|
|
|
BB |
0 |
|
|
|
|
|
0 |
BB |
|
|
|
|
|
|
|
$1000 |
|
|
|
|
|
$1200 |
|
|
|
|
|
|
|
|
|
$100 |
|
|
|
|
|
|
|
|
|
|
|
|
|
$100 |
|
|
|
|
|
|
|
|
|
|
|
|
|
|
|
$100 |
|
|
|
|
|
|
|
7000-000 |
|
5070-000 |
|
4010-000 |
|||||||||
|
Inventory Adjustments |
|
Cost of Goods Sold |
|
Sales |
|||||||||
|
BB |
0 |
|
|
|
BB |
0 |
|
|
|
|
|
0 |
BB |
|
|
$100 |
|
|
|
|
$100 |
|
|
|
|
|
|
|
|
7010-000 |
|
7020-000 |
|
5080-000 |
|||||||||
|
Purchase Variance |
|
Cr Memo/Adj Variance |
|
Credit Memo |
|||||||||
|
BB |
0 |
|
|
|
BB |
0 |
|
|
|
|
|
0 |
BB |
|
|
$200 |
|
|
|
|
|
|
|
|
|
|
$100 |
|
Distributions to General Ledger after a Downward Adjustment
Print the Distributions to G/L Report by selecting Distributions to G/L from the Reports menu. Use First to Last for both the account number range and the date range.
Valuation Reports after a Downward Adjustment
Now print valuation reports using Standard Cost and then actual cost.
Select Valuation report from the Reports menu, and print Valuation reports for item number 3, one using Standard Cost and one using average cost.
Item Data after a Downward Adjustment
Now examine Item data again.
Note that the average cost has been updated due to this downward adjustment, reversing the effect of the credit memo transaction on Items.
After viewing this screen, examine the Status screen.
On the status information screen, only the quantity on hand has changed.
The next transaction will illustrate the handling of an upward, or positive adjustment.
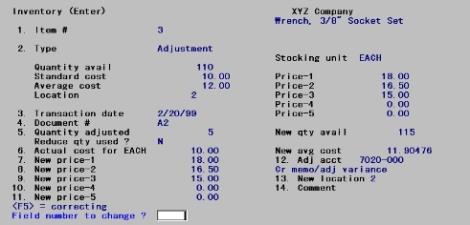
Adjustment transactions allow you to adjust your inventory to reflect the actual physical count in your warehouse(s). Note that, in this example, average cost is used to make the adjustment.
Posting an Upward Adjustment
Select Post from the Inventory menu to post the above adjustment. A register will be printed.
Posting causes certain fields in Item data and I/C Distributions to G/L to be updated. Items data and Distributions data changes are illustrated below, along with T-account representations of the posting activity.
|
Old Qty. |
Old Avg. Cost |
New Qty |
New Avg. Cost |
|
90 |
$12.00 |
95 |
$12.00 |
Actual entries in I/C Distributions to G/L:
Debit Merchandise Inventory $50
Credit Inventory Adjustments $50
|
1100-000 |
|
1200-000 |
|
2000-000 |
|||||||||
|
Accounts Receivable |
|
Merchandise Inventory |
|
Accounts Payable |
|||||||||
|
BB |
00 |
|
|
|
BB |
0 |
|
|
|
|
|
0 |
BB |
|
|
$100 |
|
|
|
|
$1000 |
|
|
|
|
|
$1200 |
|
|
|
|
|
|
|
|
|
$100 |
|
|
|
|
|
|
|
|
|
|
|
|
|
$100 |
|
|
|
|
|
|
|
|
|
|
|
|
|
|
|
$100 |
|
|
|
|
|
|
|
|
|
|
|
|
|
$50 |
|
|
|
|
|
|
|
|
7000-000 |
|
5070-000 |
|
4010-000 |
|||||||||
|
Inventory Adjustments |
|
Cost of Goods Sold |
|
Sales |
|||||||||
|
BB |
0 |
|
|
|
BB |
0 |
|
|
|
|
|
0 |
BB |
|
|
$100 |
|
|
|
|
$100 |
|
|
|
|
|
|
|
|
|
|
$60 |
|
|
|
|
|
|
|
|
|
|
|
|
7010-000 |
|
7020-000 |
|
5080-000 |
|||||||||
|
Purchase Variance |
|
Cr Memo/Adj Variance |
|
Credit Memo |
|||||||||
|
BB |
0 |
|
|
|
BB |
0 |
|
|
|
|
|
0 |
BB |
|
|
$200 |
|
|
|
|
$10 |
|
|
|
|
|
$100 |
|
Distributions to General Ledger after an Upward Adjustment
Print the Distributions to G/L Report by selecting Distributions to G/L from the Reports menu. Use First to Last for both the account number range and the date range.
Valuation Reports after Upward Adjustments
Now print valuation reports using Standard Cost and then actual cost.
Example: Select Valuation report from the Reports menu, and print Valuation reports for item number 3, one using Standard Cost and one using average cost.
Item Data after Upward Adjustments
Examine Item data again.
After viewing this screen, look at the Status screen.
Note only the quantity on hand has changed.
Disposition of Variances
At year end, your Merchandise Inventory and Cost of Goods Sold accounts will be at standard. You may also have entries in your Credit Memo/Adjustment Variance and Purchase Variances accounts. Generally accepted accounting principles require that you present reconciled figures for inventory and cost of goods.
Allocation of Variances at Year End or Prior to Changing any Standard Unit Cost
In order to reconcile these figures to actual cost, you must allocate the total variances accumulated throughout the year in the Purchase Variances and Credit Memo/Adjustment Variance accounts. The net variance should be posted (debited and credited) to the Merchandise Inventory and Cost of Goods Sold accounts by means of a General Journal entry (in the G/L module). No transaction entry is required in Inventory Control.
Procedures for Allocation of the Variances and Determining the Adjustment Amounts
The net variance for the year can be determined by adding the balances in the Purchase Variances and the Credit Memo/Adjustment Variance accounts. This net variance can then be allocated in either of the two following methods, or another method more appropriate to your needs.
You should consult an accountant to determine the appropriate method of allocation.
Method #1
| 1. | Determine the total goods available for the period by adding ending inventory and the cost of goods sold figures. |
Ending inventory (std) + Cost of goods sold (std) = Total goods available (std)
| 2. | Divide ending inventory by the total goods available for the period. |
Ending inventory (std) / Total goods available (std) = Ratio
| 3. | Multiply this ratio by the net variance. The resulting figure represents the portion of the net variance that should be allocated to the ending inventory balance. |
Ratio x Net variance = Ending inventory portion
(Amount needed to adjust inventory to actual cost)
| 4. | The remaining amount represents the portion to be allocated to the cost of goods sold balance. |
Net variance - Ending inventory portion = Cost of goods sold portion
(Amount needed to adjust COGS to actual cost)
| 5. | The following entry would be made to allocate the variance, assuming the net variance was a debit balance: |
Debit Merchandise Inventory
Debit Cost of Goods Sold
Credit Purchase Variances
Credit Memo/Adjustment Variance
A second method is illustrated below:
Method #2
| 1. | Print Valuation Reports at actual and at Standard Cost. |
| 2. | The difference between the two inventory figures (total at actual cost minus total at Standard Cost) is the net variance that is needed to adjust inventory at standard to inventory at actual (Ending inventory portion). |
| 3. | The Cost of goods sold portion is calculated by subtracting the Ending inventory portion from the net variance amount. |
| 4. | The following entry would be made to allocate the variance, assuming the net variance was a debit balance: |
|
Debit Merchandise Inventory |
|
|
|
Credit Purchase Variances |
|
Note |
Standard costs are not usually changed during the year. However, if your circumstances dictate that a change is needed, and your accountant agrees, changes are allowed in this system. |
Prior to changing even one standard unit cost, though, it is necessary to allocate the net variances that have been accumulated to date. All outstanding transactions should be posted, and then the procedures outlined above for year-end allocation should be followed and the appropriate journal entries made.
After the journal entries have been made, your General Ledger module will have inventory at actual cost, and your Inventory Control module will have inventory at Standard Cost.
To state your General Ledger inventory at Standard Cost, you would make the following entries:
Debit Purchase Variances
Debit Credit Memo/Adjustment Variance
Credit Merchandise Inventory
This will allow you to continue using Standard Cost on a daily basis. Notice that you do not have to make any reversing journal entries for Cost of Goods Sold, because it is an expense account.